Binary Classification Metrics
Motivation
Once a binary classifier is trained we need to evaluate its performance. This is done using some evaluation metrics calculated on an unseen test set.
Decision Threshold
We assume that our binary classifier outputs probability of being a positive class for each test sample. We can set a threshold to convert the probability into a binary prediction. For example, if the probability is greater than 0.5, we predict the sample to be positive, otherwise we predict it to be negative.
Confusion Matrix
After applying the threshold, for each example we compare the actual label to the predicted label:
Predicted positive |
Predicted negative |
|
|---|---|---|
Actual positive |
True positive (TP) |
False negative (FN) |
Actual negative |
False positive (FP) |
True negative (TN) |
These four counts completely describe mistakes and correct decisions at that threshold.
True Positive Rate and False Positive Rate
True positive rate (TPR), also called recall or sensitivity, is the fraction of actual positives we correctly flag:
\[\text{TPR} = \frac{\text{TP}}{\text{TP} + \text{FN}}\]
False positive rate (FPR) is the fraction of actual negatives we wrongly label positive:
\[\text{FPR} = \frac{\text{FP}}{\text{FP} + \text{TN}}\]
The complementary quantity specificity is \(\text{TNR} = 1 - \text{FPR}\) — the fraction of negatives correctly rejected. ROC analysis plots TPR against FPR specifically because both are rates conditioned on ground truth (row-normalized), which makes curves comparable across datasets with different class balances.
Precision
Precision answers: among predicted positives, how many were right?
\[\text{Precision} = \frac{\text{TP}}{\text{TP} + \text{FP}}\]
It is not on the ROC axes but is central when the cost of acting on a positive prediction is high (e.g. expensive follow-up tests). Precision–recall curves are often preferred when negatives vastly outnumber positives.
F1 Score
F1 score is the harmonic mean of precision and recall:
\[\text{F1} = 2 \times \frac{\text{Precision} \times \text{Recall}}{\text{Precision} + \text{Recall}}\]
It is a balanced measure that considers both precision and recall.
ROC Curve and Random Baseline
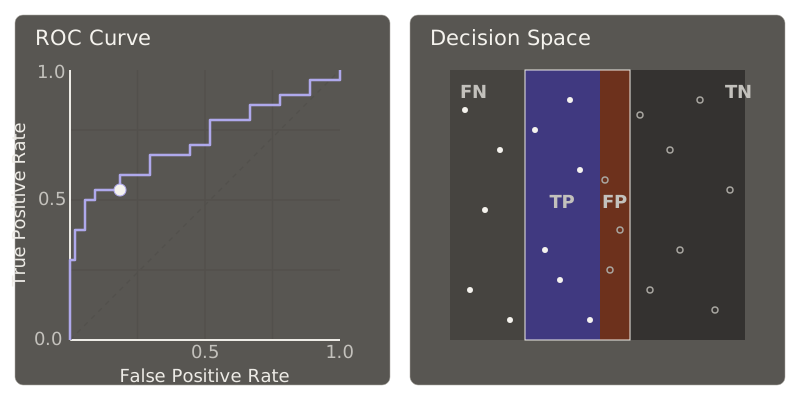
The receiver operating characteristic (ROC) curve traces \((\text{FPR}, \text{TPR})\) as the classification threshold sweeps from “call everything negative” to “call everything positive.” A model that ranks positives higher than negatives bows above the diagonal; the diagonal itself represents random guessing (TPR equals FPR at every threshold). The area under the ROC curve (AUC–ROC) is a single number summarizing ranking quality: \(1\) is perfect separation, \(0.5\) is no skill.
Threshold as a Trade-Off
Lowering the threshold typically increases both TPR and FPR — we catch more true positives but also raise more false alarms. There is no universally best threshold: it depends on relative costs of FN vs. FP and on the base rate of positives. The demo makes this concrete: the same scoring rule yields different operating points along the ROC as you move the threshold, and the decision view shows how the predicted-positive region overlaps true positives (TP) vs. true negatives miscalled positive (FP), with FN and TN in the remaining regions.